Sketchpad Gallery
Many of the Whistler Alley Mathematics topics include Geometer’s Sketchpad files. Here are some more that are not attached to any particular lesson. The GSP4 files seem to be behaving well in GSP5, the current software version, so most of them have been retained without changing the format.
It has been brought to my attention that many of my animated sketches are unreasonably slow because I tend to set the locus samples very high. If your computer is not driving the animation fast enough, try this fix. Select any loci you see on the screen (including graphs). Hit the [-] key several times. This will degrade the resolution of the curve, but it will also allow the animation to run faster.
Many of these sketches (particularly the physics files) are suitable for classroom demonstrations. If you are using the file for that purpose, let me recommend that you change most of the line weights to medium or thick.
 Calculus Calculus
 Integral — Several concepts are modeled here, including Riemann Sums, Simpson’s Rule, and the antiderivative. Integral — Several concepts are modeled here, including Riemann Sums, Simpson’s Rule, and the antiderivative.
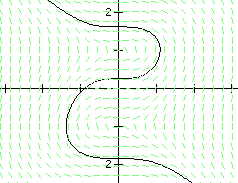
 Slope_field — This is something that gets a lot of use in differential equations classes. A function of x and y defines the slope. A curve can be approximated by simply drawing along the grain. In this sketch, the size and density of the field can be changed. A point representing an initial condition can be dragged across the field and the curve through that point is drawn. Slope_field — This is something that gets a lot of use in differential equations classes. A function of x and y defines the slope. A curve can be approximated by simply drawing along the grain. In this sketch, the size and density of the field can be changed. A point representing an initial condition can be dragged across the field and the curve through that point is drawn.
Physics

 Doppler — An animated sketch models the Doppler effect and sonic booms. Doppler — An animated sketch models the Doppler effect and sonic booms.
 E-field — Point charges create an electric field. Watch the effects on the field when the charges and positions of the points are changed. It also has a geometric representation of a voltage calculation and two movable equipotential curves. E-field — Point charges create an electric field. Watch the effects on the field when the charges and positions of the points are changed. It also has a geometric representation of a voltage calculation and two movable equipotential curves.
 Interference — Young’s slit experiments for light wave interference are simulated. Interference — Young’s slit experiments for light wave interference are simulated.
 Maxwell2 — Maxwell’s equation relating electric and magnetic waves is shown with a model of both waves travelling along the same axis and changing in orthogonal directions. The three dimensions are shown in perspective view. This is actually a file from the perspective series, but all of the geometric construction has been hidden in order to create a more useful physics demonstration. Maxwell2 — Maxwell’s equation relating electric and magnetic waves is shown with a model of both waves travelling along the same axis and changing in orthogonal directions. The three dimensions are shown in perspective view. This is actually a file from the perspective series, but all of the geometric construction has been hidden in order to create a more useful physics demonstration.
 Perspective Perspective
These are a few files that were created to model the tools included in the Perspective_Tools file.
 globe globe
 maxwell maxwell
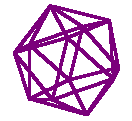
 solids solids
 soma soma
 torus torus
 3D_Chaos_Game — This last one is not mine. It was sent to me by Nick Jackiw after a GSP Summer Institute. It makes an interesting and effective demonstration. 3D_Chaos_Game — This last one is not mine. It was sent to me by Nick Jackiw after a GSP Summer Institute. It makes an interesting and effective demonstration.
Others
 Conic Sections.gsp — You know how it works. A cone is intersected by a plane. Here you can adjust the cone and the plane and see the changes in the intersecting curve. Conic Sections.gsp — You know how it works. A cone is intersected by a plane. Here you can adjust the cone and the plane and see the changes in the intersecting curve.
 Graph_Paper — This replaces the version 3 Graph file that used to appear here. It is intended to help people customize graphs that are being prepared for printed material. It offers a lot of options for the grid and tick mark spacing, index numbers, and colors. Graphs can be plotted on the custom coordinate system, but it is also convenient for printing a blank grid for hand plotting. Graph_Paper — This replaces the version 3 Graph file that used to appear here. It is intended to help people customize graphs that are being prepared for printed material. It offers a lot of options for the grid and tick mark spacing, index numbers, and colors. Graphs can be plotted on the custom coordinate system, but it is also convenient for printing a blank grid for hand plotting.

 Inequality.gsp — One, two, or three linear inequalities are graphed on the Cartesian plane. Inequality.gsp — One, two, or three linear inequalities are graphed on the Cartesian plane.
 Kaleidoscope.gsp — As with a real kaleidoscope, these beautiful patterns are created by simple reflections of colorful, nondescript objects. Kaleidoscope.gsp — As with a real kaleidoscope, these beautiful patterns are created by simple reflections of colorful, nondescript objects.
 Linear_Algebra — This idea came from Rick Nungester. Polynomial functions are fit to free points on the coordinate grid. Custom tools were created to calculate determinants of square matrices up to dimension 5. The solutions are purely analytical. Linear_Algebra — This idea came from Rick Nungester. Polynomial functions are fit to free points on the coordinate grid. Custom tools were created to calculate determinants of square matrices up to dimension 5. The solutions are purely analytical.
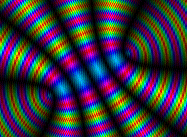
  Images.gsp — One of the beta releases of version 4 had a file showing how to make a family of ellipses by using the parameterized colors. I did some variations on that idea and came up with some striking images. Images.gsp — One of the beta releases of version 4 had a file showing how to make a family of ellipses by using the parameterized colors. I did some variations on that idea and came up with some striking images.
 Shells — As a child, I once tried to draw a similar design on Dad’s drafting table. I was working in ink. One line in the wrong place, and I blew a week of work. Custom tools and iterations were used to create this sketch in only a few minutes. If the iterations could be carried out infinitely, it would be a two-color map, with no adjacent regions having the same color. Shells — As a child, I once tried to draw a similar design on Dad’s drafting table. I was working in ink. One line in the wrong place, and I blew a week of work. Custom tools and iterations were used to create this sketch in only a few minutes. If the iterations could be carried out infinitely, it would be a two-color map, with no adjacent regions having the same color.
 Spiral — These spiral constructions were inspired and guided by the book Mathographics, by Robert Dixon. An iterated parameter was used to translate his BASIC code into something that Sketchpad could deal with. Spiral — These spiral constructions were inspired and guided by the book Mathographics, by Robert Dixon. An iterated parameter was used to translate his BASIC code into something that Sketchpad could deal with.
 Trigonometry — These are some useful images for understanding several trigonometry concepts. One is a unit circle with six trigonometric functions of an acute angle modeled as lengths of line segments, and three identities presented by applying the Pythagorean Theorem. Another is a geometric construction of six trigonometric function graphs. Trigonometry — These are some useful images for understanding several trigonometry concepts. One is a unit circle with six trigonometric functions of an acute angle modeled as lengths of line segments, and three identities presented by applying the Pythagorean Theorem. Another is a geometric construction of six trigonometric function graphs.
Last update: February 2, 2012 ... Paul Kunkel whistling@whistleralley.com
For email to reach me, the word geometry must appear in the body of the message.
|
 Calculus
 Perspective
